You probably already have a list of about one hundred different content marketing metrics that you could use to track and measure the success of your content strategy. However, if you try tracking too many metrics, you’ll either:
- Feel overwhelmed and give up before you get started and ultimately track nothing
- Track all 100 metrics, but with so many different signals, you won’t take action on the data
Another issue with content marketing metrics is that setting up tracking can be very difficult (or even impossible) depending on the tools provided by your company and your own technical abilities.
So instead of writing a post that gives you hundreds of metrics to track, this post takes a look at the six most important content marketing metrics.
One of the first questions people ask me when we start a new content marketing strategy together is: “How long will it take to see results?”
The answer isn’t always want they want, because content marketing is a marathon, not a sprint. In the vast majority of cases, you’ll see results start to trickle in slowly and grow exponentially instead of flooding in all at once. But that doesn’t mean that you shouldn’t be tracking your content marketing.
Although tracking your content marketing and the results it’s yielding is definitely more difficult than monitoring clicks and conversions of a PPC campaign, putting the right KPIs in place and utilizing the right tools can allow you to track it pretty accurately and make it easier for yourself to organize and report.
And it’s essential to do so, because if you aren’t tracking results – or aren’t tracking them correctly – you’ll get vague data that won’t help you at all. You could end up spending a lot of time and money on strategies or content that just isn’t working. You can’t grow, after all, if you don’t understand what’s happening or if you’re monitoring vanity metrics and false positives such as likes and comments instead of the right actions.
New to content strategies? Check out:
How to Create a High-Performance Content Marketing Strategy in 2023
The 6 Most Important Content Marketing Metrics
Let’s go through and examine each one.
1) Conversions
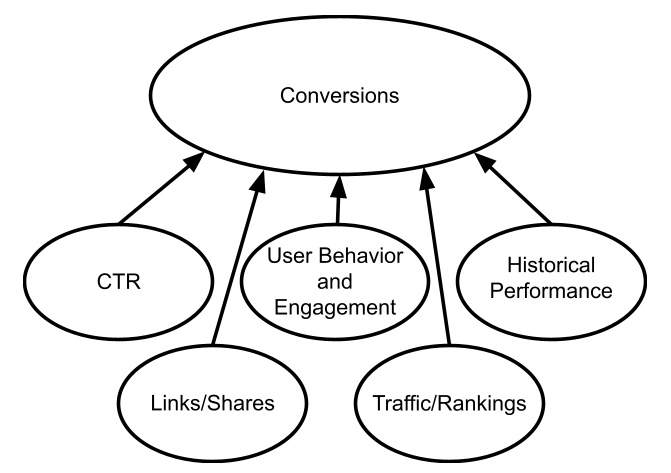
Tracking conversions is at the top of this list because the end goal of your content should always be to drive more business. While all the other metrics listed below are important, they ultimately exist to help you achieve conversions.
Put simply, conversions are your north star, and all the other metrics are paths leading to it:
Unfortunately, most people tend to lose sight of conversions as a content marketing metric due to the complexity of the customer journey. For example, did a new customer convert from the email campaign and just coincidentally read a blog post? And was the blog post a critical element that pushed them to ultimately purchase the product?
For this reason, many companies, while they admit that their main content marketing goal is to drive conversions, don’t make any attempt to track conversions from content.
Even if it’s not a perfect metric, tracking conversions is still useful as you’ll soon see which pieces of content are ultimately tied to a sale. This way, you can ensure that the content team continues producing posts similar to those that often end in a conversion.
Another reason why many businesses don’t track conversions from content is that, until a few years ago, there wasn’t an easy way to track conversions from content. You can hire a developer to set up tracking in Google Analytics, but that doesn’t provide the full customer journey (only first touch and last touch data).
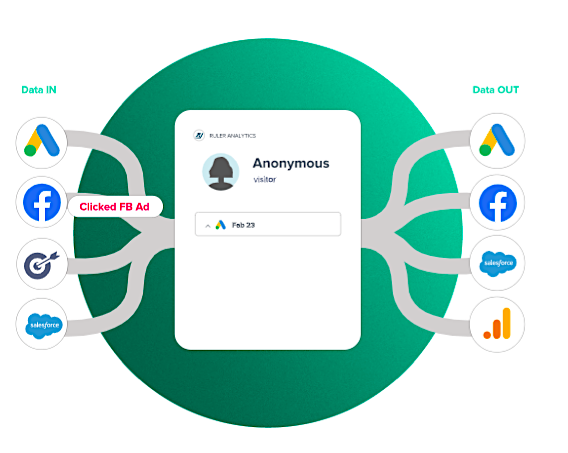
Now, however, companies like Oribi and Ruler Analytics exist and make it much easier to track the entire customer journey:
- You can identify which blog posts show up the most in customer journeys that end in a sale
- You can pinpoint precisely where the content showed up in the customer journey
- You can see how much time passed before the conversion happened
Tracking the entire customer journey is helpful because if a particular post tends to be consumed within a few days of the conversion, there’s a very good chance that the content directly caused the conversion.
While these tools aren’t cheap, they are super easy to set up and provide much more insight than older tools like Google Analytics.
Regardless of how you choose to track your conversions, setting up some kind of tracking will be useful as it can teach you what kind of content to create in the future to improve your bottom line.
Before you track conversions, make sure you optimize them:
15 Fast and Easy Ways to Improve Your Site’s Conversion Rate
2) CTR (Click-Through Rate)
If people consistently click on your listing in the SERPs, Google will assume it is an excellent answer to the search term. Since every search engine’s goal is to provide the searcher with the best answer to their question, they will rank you higher.
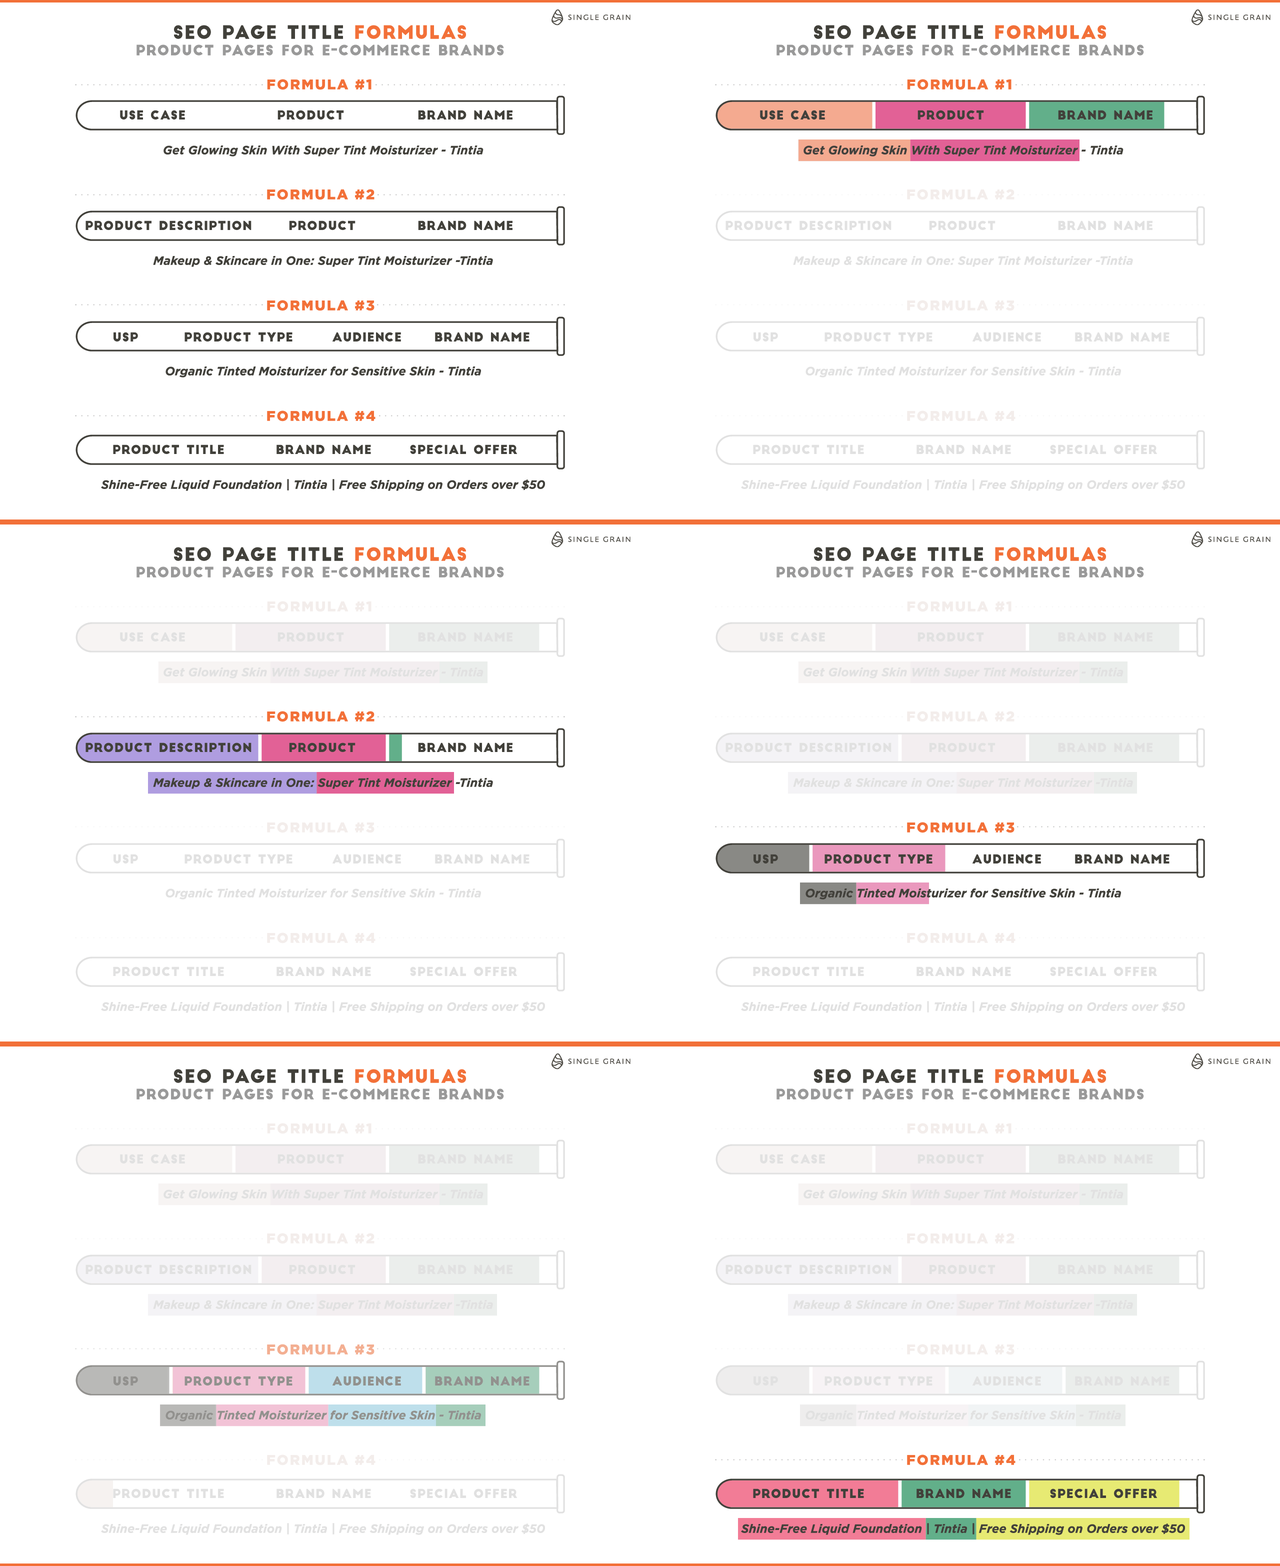
Therefore, it’s important to optimize your title tag and meta description to be as appealing as possible without being misleading.
This template can help you with your title tags:
Here are a few tips to help you improve your CTR via the title tag and meta description:
- Include the current year in the title – this is particularly helpful for guides and list posts – but not in the URL
- Include the main keyword in the title tag and meta description
- Use structured data whenever possible
- Ensure that each title falls between 15 and 40 characters
- Add sentiment to your titles (either positive or negative)
While I could make an endless list about what you should and shouldn’t do to increase your CTR, the best framework I’ve found to help me write better title tags and meta descriptions is to take a second and think about the search intent behind the keyword. Specifically, I ask myself two questions:
- What is that searcher’s pain point?
- How can I communicate to them (through the title tag and meta description) that my content provides the solution to their pain point (i.e. answer to their question)?
Once you think through those two questions, creating an effective title and meta description is pretty straightforward.
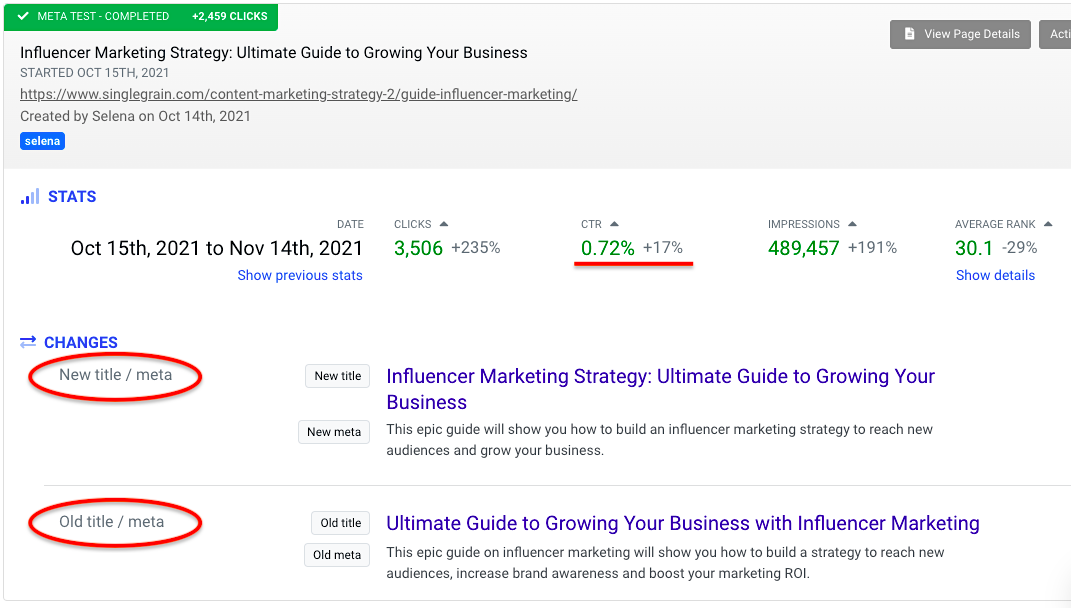
However, just because you’ve picked a title that you think is great doesn’t always mean that it will perform well. Therefore, A/B test your title tag and meta description to reduce the guesswork and see which one performs the best.
You can use a content optimization tool, which allows you to test two different title tags/meta descriptions to see which one performs better. Here’s an example of a test we recently ran:
If you have hundreds of blog posts, it’s unrealistic that you’ll be able to test every single title and meta description. So how should you prioritize? To start improving your CTRs, you can either scroll through Google Search Console and manually identify these posts or use a tool, which will automatically show you a list of posts with high impressions yet low clicks.
In addition, keep an eye on your top-performing posts and continuously update those title tags/meta descriptions (even if the CTR is decent). This is because:
If you improve a post that’s pulling in 5,000 visitors per month by just 1%, you’ll see a much higher ROI than if you improve a mediocre post doing 100 visitors per month by 10%.
To identify your highest-performing posts, you can use a tool like Ahrefs to view the top-performing pages by traffic (Organic Search > Top Pages on the left side of the page) and manually keep an eye on those post’s CTRs (either in Google Search Console or in Click Flow):
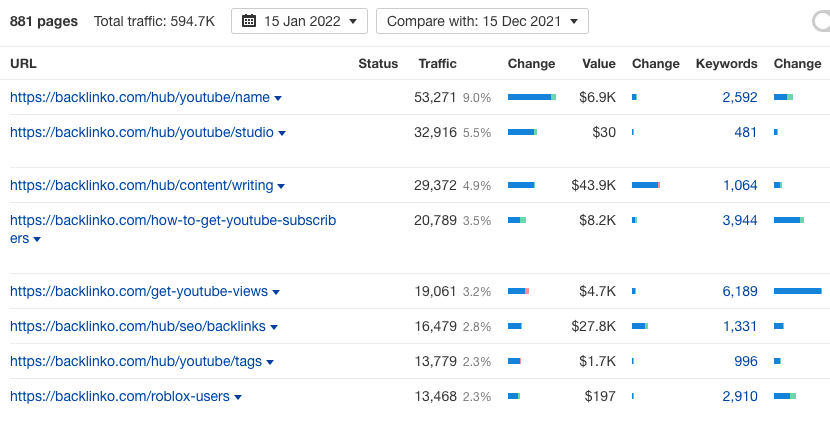
Improving your CTR is one of the most underrated content marketing tactics you can leverage, as it requires minimal effort yet has a significant impact on your content’s organic performance.
Need a refresher on improving CTRs? Read this:
11 Proven Hacks to Increase Your Organic CTRs 👆
3) User Behavior and Engagement
Google’s page experience update makes it more important than ever to track your user signals. While user experience conversations are often directed towards SEO folks, this topic is also essential for content marketers to consider.
So what kind of user behavior metrics should you track?
Time on page is perhaps the most important one. Though some search queries (such as “what’s today’s weather?” and “how many days are in February?”) don’t require a long time on page, guides, comparison posts and more detailed topics generally should.
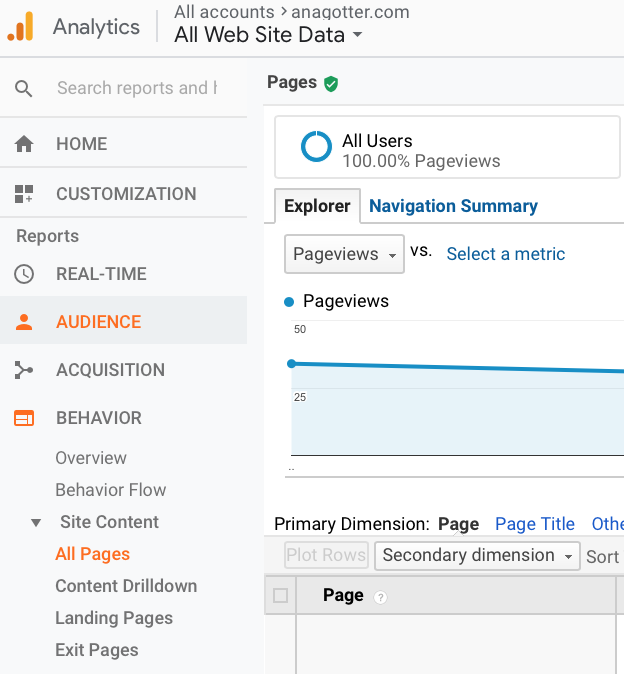
To view the time on page for each blog post, just log into your Google Analytics account. From there, go to Behavior > Site Content > All Pages to see the average time on page for each post:

So how can you improve your time on page and overall reader engagement?
Here are a few ideas:
- Use beautiful graphics, short paragraphs, and clear subheadings (think Backlinko-style posts).
- Ensure that your font is large enough that it can be read from about 4-6 feet away.
- Improve the page load speed (you can use a tool like Pagespeed Insights to test the page speed).
- Review your copy to see where readers typically stop reading (use a heat map tool like Hotjar for this).
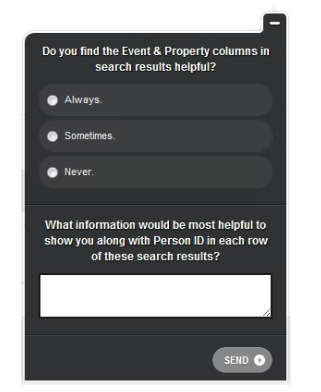
Finally, the best way to improve your user experience is to ask readers what they think of your content. Hotjar offers a question box feature, or you can use a tool like Qualaroo:
4) Historical Performance
Historical performance is a crucial metric that often gets overlooked. By analyzing how your content has performed over time, you can gain valuable insights into what works best for your audience and how to improve your content strategy.
Here are some key aspects to consider when evaluating historical performance:
Content Decay
Content decay refers to the gradual decline in organic traffic to a piece of content over time. This is natural as content becomes outdated or loses relevance. Google, for example, tends to prioritize recency in search results as you can see below:
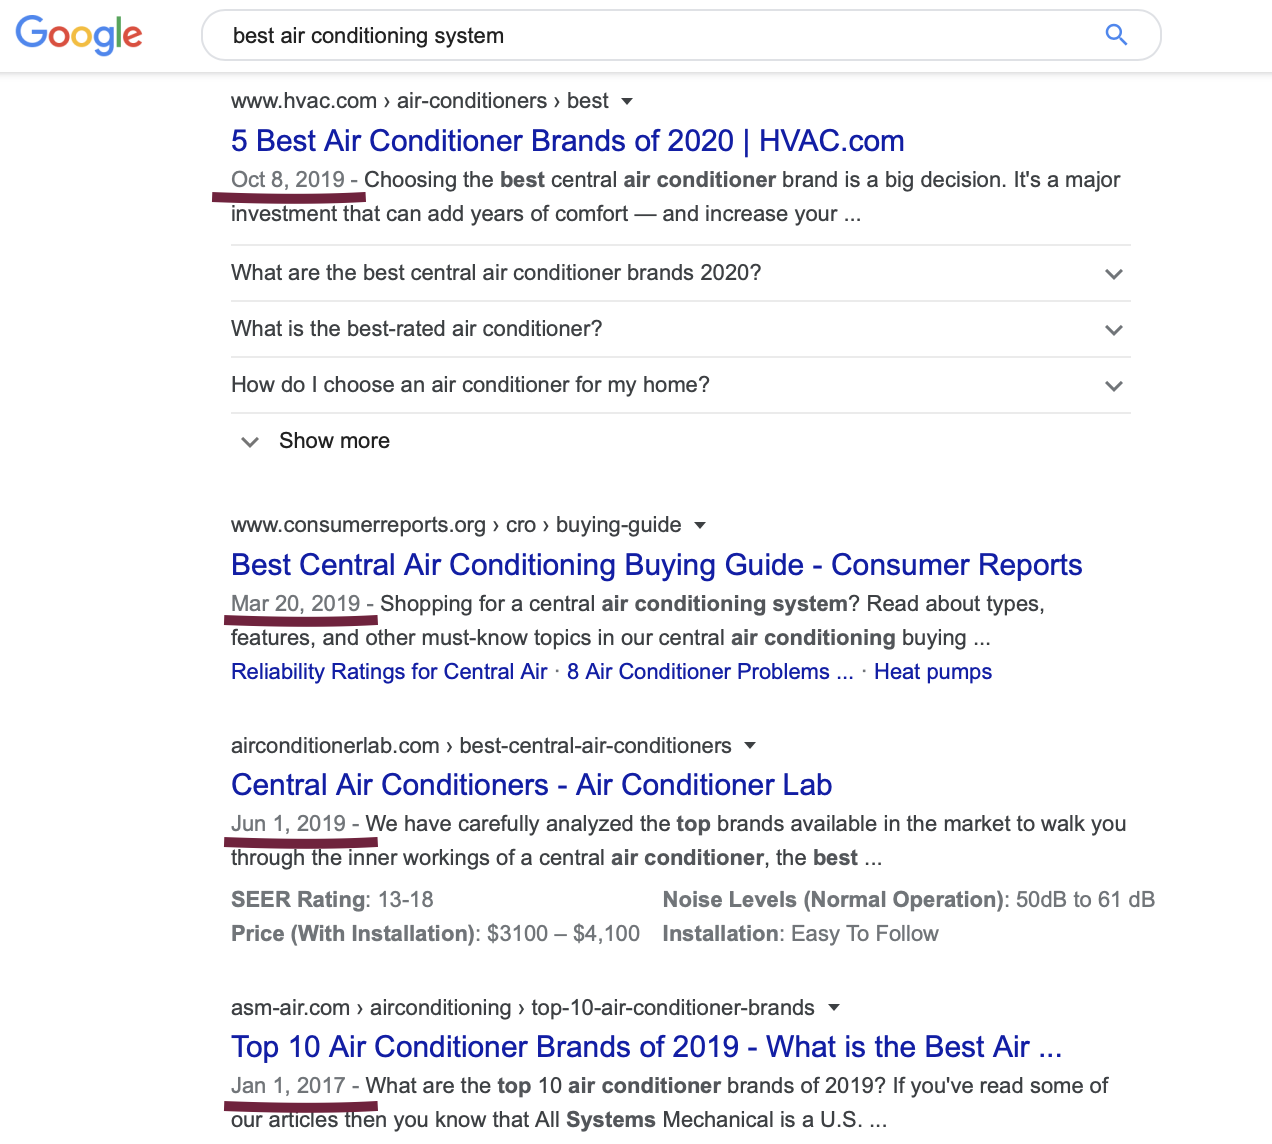
By identifying content decay early, you can update and refresh your content to maintain or even improve its performance.
Use tools like Google Analytics or Ahrefs to track the traffic to your posts over time. If you notice a significant drop in traffic to a previously high-performing piece, it might be time for an update. Here’s a process to combat content decay:
- Identify decaying content: Look for posts that have seen a 20% or more drop in traffic over the past 3-6 months.
- Analyze the cause: Is the information outdated? Has the search intent changed? Are there new competitors for the same keywords?
- Update and optimize: Refresh statistics, add new sections, improve internal linking, and ensure the content still matches search intent.
- Republish and promote: After updating, change the publish date and reshare on social media platforms.
Evergreen vs. Temporal Content
Analyze which types of content tend to perform well over long periods (evergreen) versus those that have short-lived spikes in traffic (temporal). This can help you balance your content strategy between timely, newsworthy pieces and long-lasting, resource-type content.
To identify evergreen content:
- Look for posts that maintain consistent traffic over time
- Topics that aren’t tied to specific dates or events
- Content that addresses fundamental questions or problems in your niche
For temporal content:
- News or trend-related posts
- Content tied to specific events or seasons
- Posts that see traffic spikes followed by quick declines
Aim for a mix of both in your content strategy. For example, you might aim for 70% evergreen content and 30% temporal content to balance long-term value with timely engagement.
Seasonal Trends
Look for patterns in your content performance that correlate with certain times of the year. This can help you plan your content calendar more effectively, producing seasonal content at the right time to maximize its impact.
To identify and leverage seasonal trends:
- Use Google Analytics to view traffic patterns over a full year
- Note any recurring spikes or dips in traffic
- Cross-reference these with known seasonal events or holidays
- Plan content around these trends, publishing at least a month in advance to allow for indexing and ranking
For example, if you run a fitness blog, you might notice traffic spikes for weight loss content in January (New Year’s resolutions) and early summer (pre-beach season). Plan to have fresh, relevant content ready for these periods.
5) Shares and Links
Social shares and backlinks are important indicators of your content’s quality and relevance. They also play a crucial role in expanding your content’s reach and improving its search engine rankings.
Social Shares
While social shares don’t directly impact SEO, they can increase your content’s visibility and drive more traffic to your site. Use tools like BuzzSumo or SharedCount to track social shares across different platforms:
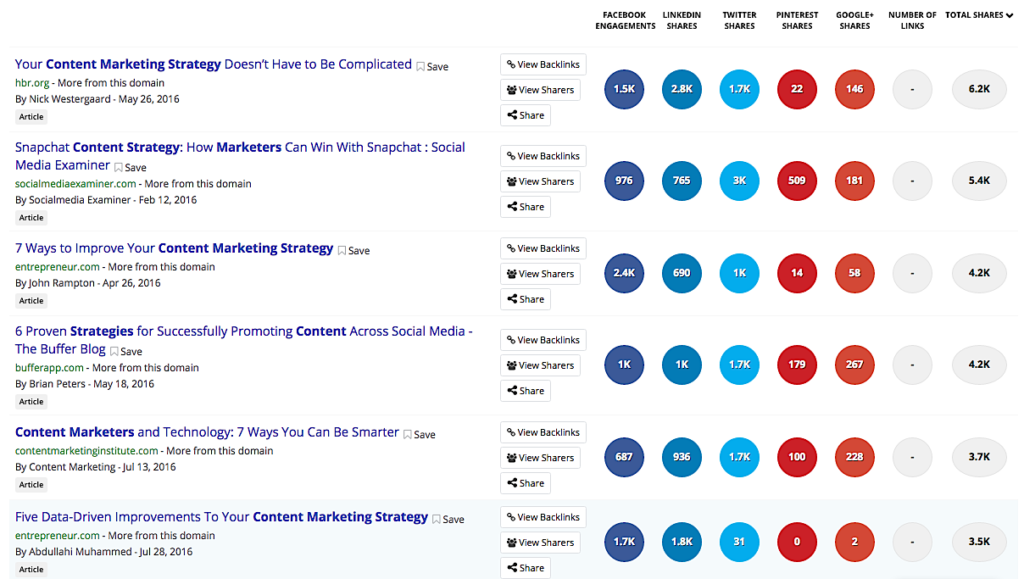
Pay attention to which types of content get shared most often and on which platforms. This can help you tailor your content and distribution strategy for maximum engagement. Here’s how to leverage this data:
- Identify your top-shared content: Look for common themes or formats
- Analyze platform performance: Which social networks drive the most engagement?
- Optimize share-ability: Use compelling titles, eye-catching images, and clear share buttons
- Engage with sharers: Thank people who share your content and encourage further discussion
Remember, different types of content may perform better on different platforms. For example, infographics often do well on Pinterest, while in-depth articles might get more traction on LinkedIn.
Backlinks
Backlinks from reputable sites are a strong signal to search engines about your content’s quality and authority. Use tools like Ahrefs or Moz to track the number and quality of backlinks to your content.
Analyze which pieces of content attract the most high-quality backlinks. Is it in-depth guides? Original research? Infographics?
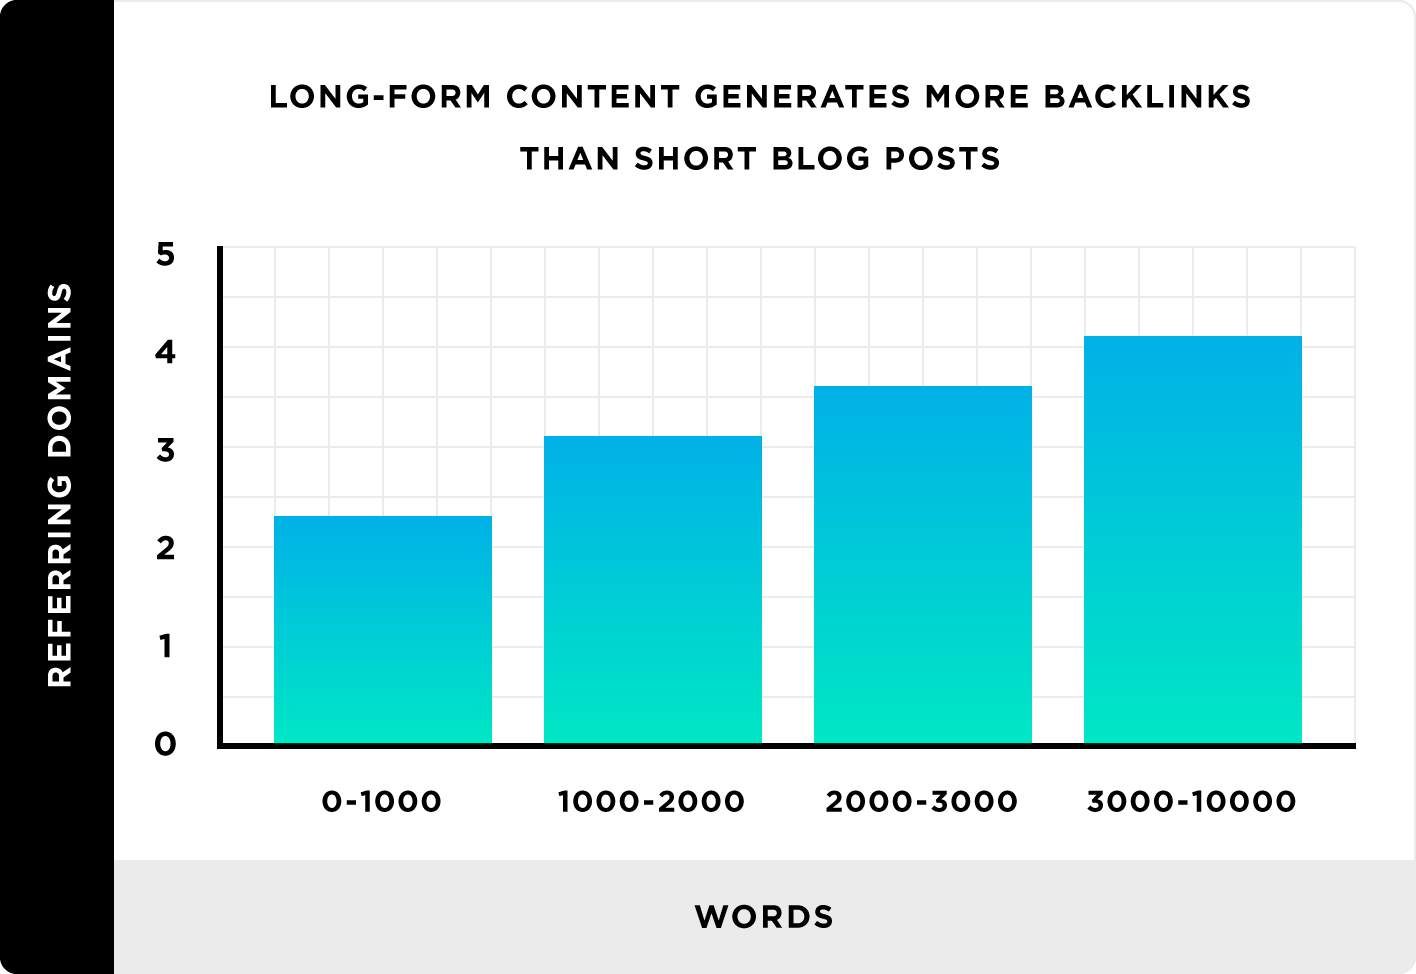
Use these insights to inform your content creation strategy. Here’s a process to improve your backlink profile:
- Conduct a backlink audit: Identify your most linked-to content
- Analyze link quality: Focus on links from high-authority, relevant sites
- Identify link patterns: What type of content attracts the most links?
- Create link-worthy content: Based on your analysis, create more content likely to attract backlinks
- Promote strategically: Reach out to relevant sites that might be interested in linking to your content
6) Traffic and Rankings
While traffic and rankings shouldn’t be your only focus, they are important indicators of your content’s performance and visibility.
Organic Traffic
Track your organic traffic using Google Analytics. Look at both overall trends and performance of individual pieces of content. Which topics or types of content consistently bring in the most organic traffic?
To improve organic traffic:
- Identify top-performing pages and topics
- Optimize underperforming content
- Create more content around successful themes
- Ensure your site is technically sound (e.g., fast load times, mobile-friendly)
Keyword Rankings
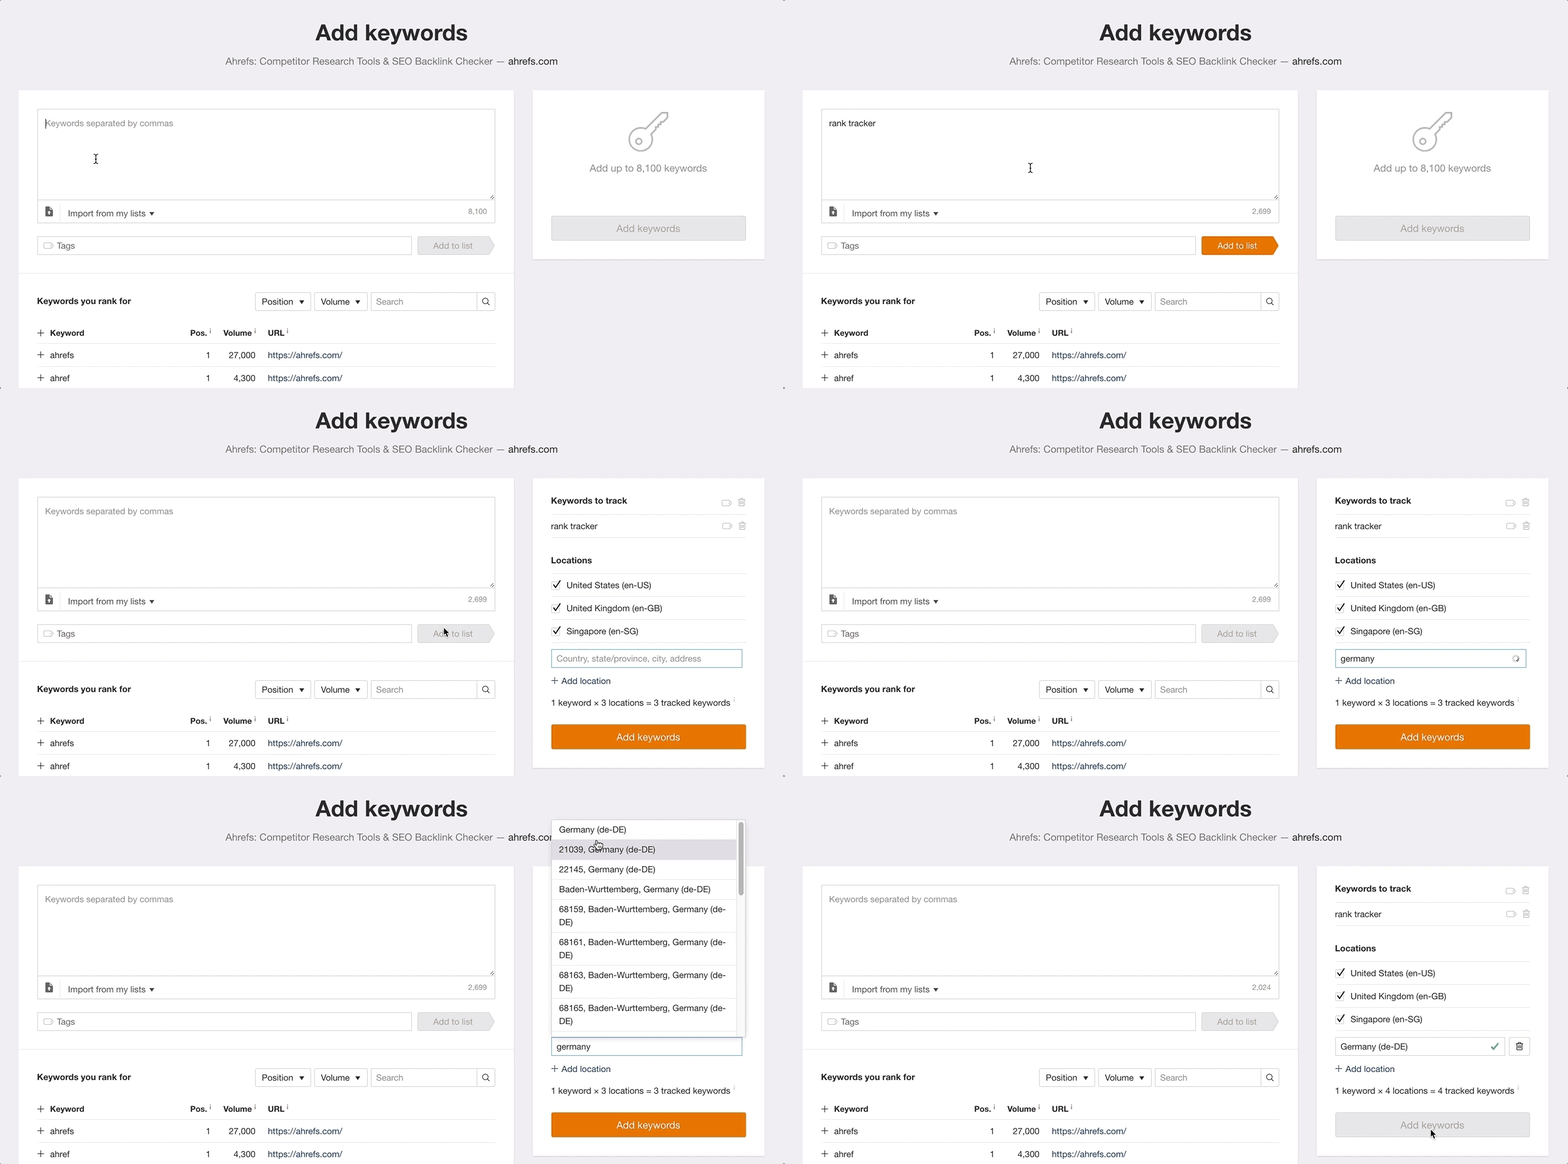
Use tools like SEMrush or Ahrefs to track your rankings for target keywords. Pay attention to how your rankings change over time and after content updates or link building efforts:
To improve keyword rankings:
- Identify keywords where you’re ranking on page 2 or 3
- Optimize existing content for these keywords
- Build quality backlinks to these pages
- Create new, comprehensive content for valuable keywords you’re not yet targeting
New vs. Returning Visitors
Look at the ratio of new to returning visitors. A healthy mix indicates that you’re both attracting new audiences and providing value that keeps people coming back.
To improve this metric:
- Create compelling content to attract new visitors
- Use email marketing to encourage return visits
- Implement a content series or regular features to build loyalty
- Optimize your site navigation to showcase your best content
Remember, the ideal ratio will depend on your specific goals and business model. An e-commerce site might prioritize new visitors for growth, while a membership site might focus more on retaining existing visitors.
How to Track Content Relevance
If you want your content marketing to work, your content needs to be high quality and it needs to be relevant. If either quality or relevance is missing, you won’t be able to keep audiences on board even if you do manage to attract them in the first place.
There are a few metrics that you can monitor to best assess the relevance of your content as a whole, along with individual pieces of content. Each can be found by going to the Behavior Tab on Google Analytics, and then by clicking All Pages.
Bounce Rates
Your bounce rate tells you the percentage of site visitors that only viewed a single page on your site, didn’t interact with the page outside of reading, and left your site from this same page.

Although people will sometimes come to your site looking for information, find that information and then leave, a high bounce rate typically means they didn’t find what they were looking for. If they’re reading a blog post and really love it, a decent amount of users will interact with the site in some way, including clicking on a CTA, leaving a comment, or checking out other resources you’ve linked to.
High bounce rates could mean that your content isn’t relevant to your target audience. In some cases, it could also mean that you’re not optimizing your strong content well enough; make sure you’re adding internal links in your content so you aren’t sending people elsewhere, and use clickable CTAs to send people to other areas of your site, for free trials or to lead magnets.
Exit Rates
Your exit rates tell you how often people leave your site on any given page when they view it.

Exit rates can give you similar insight as bounce rates. If you’re losing huge percentages of people on a single blog post – and you can see which individual posts have those high exit rates – then you need to look at why.
Was the post not optimized to keep readers engaged? Is the content not relevant to your target audience? Are you missing strong CTAs that would encourage users to explore your site further?
Average Time on Page
This metric tells you how long users are spending on each page of your site. Longer times typically indicate that users are engaged with and interested in your content.
If you notice that certain blog posts or pages have significantly higher average times, try to identify what makes that content particularly engaging. Is it the topic, the format, or perhaps the depth of information? Use these insights to inform your future content strategy.
Pages per Session
This metric shows you how many pages, on average, users view during a single session on your site. A higher number of pages per session usually indicates that your content is interesting enough to keep users exploring your site.
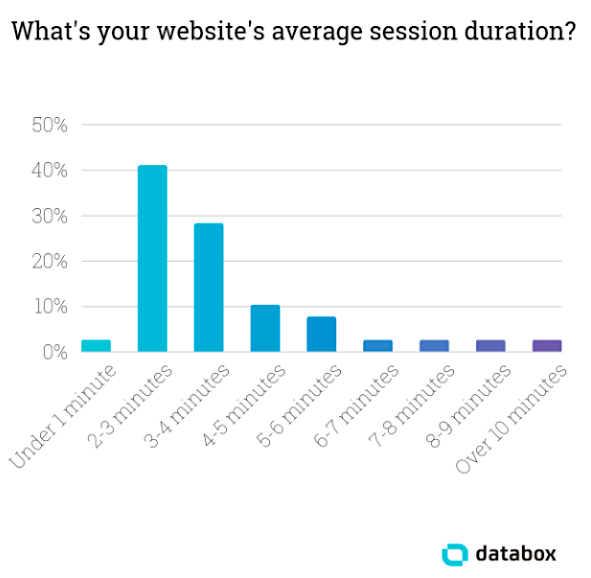
According to research, less than 45% of websites have an average session duration of 2 to 3 minutes:
If you notice that certain pages lead to higher pages per session, consider what elements on those pages are encouraging further exploration. Are there effective internal links? Compelling CTAs? Use this information to optimize other pages on your site.
Last Thoughts on Measuring Content Marketing Success
Measuring the success of your content marketing efforts is crucial for continual improvement and demonstrating ROI. While these six metrics provide a solid foundation, remember that the most important metrics for your business may vary depending on your specific goals and industry.
Regularly review these metrics, but don’t get caught up in the numbers game. Use these insights to inform your strategy, create better content, and ultimately provide more value to your audience. Remember, successful content marketing is about building relationships and trust with your audience, not just chasing metrics.
Finally, be patient. Content marketing is a long-term strategy, and it may take time to see significant results. Keep refining your approach based on the data you gather, and you’ll be well on your way to content marketing success.
Need help with measuring your content marketing metrics? Single Grain’s marketing experts can help!👇
