I’m sure that you’ll agree: trying to increase reader engagement, shares, and conversions from your blog can be darn frustrating.
And it often leaves you at your wits end, right? You try to write from personal experience, offer valuable insights, and go out of your way to promote the content but…nothing happens. Posting more often doesn’t help either.
So how come a lot of sites have such high traffic to their blog?
Readers swarm to their content, discuss and share it on every occasion, and constantly come back for more.
Want to know their secret? Many of those successful sites publish what are called data driven posts — articles that merge personal experience with scientific research and data to offer an authoritative solution.
In this article I’ll show you exactly how to write data-driven content and use it to engage more of your readers.
What Is Data-Driven Content?
A lot of online content is experiential. That is, it focuses on sharing personal stories and advice in hopes that your audience finds it helpful.
And sure, it often works. But at the same time, such content lacks the credibility and authority that many readers need to sell them on the ideas that it contains.
Enter data-driven content.
The data-driven approach focuses on creating high-quality posts that solve the audience’s problems or issues they care about by offering proof and backing up every claim with scientific findings, data, and up-to-date research.
Why publish data-driven content? For one, because it confirms your authority.
Since teachers arethe first authoritative figures in our lives, after our parents of course, we naturally develop high respect for people who can expand our knowledge.
Citing and referencing relevant research confirms that you understand this information and are willing to pass it on to others to enrich their lives.
Readers also perceive claims backed by data as more trustworthy.
Fact: we associate graphs, charts, and other data with science, and naturally, we consider science more trustworthy.
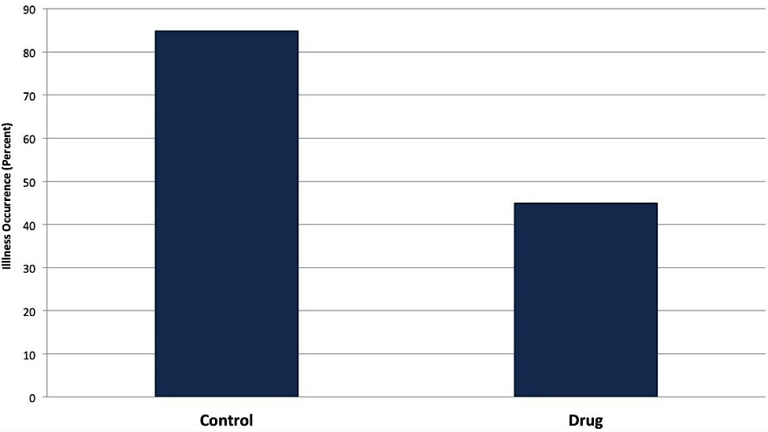
A study called Blinded with Science: Trivial Graphs and Formulas Increase Ad Persuasiveness and Belief in Product Efficacy discovered that we’re more likely to believe in claims about a new drug if they are accompanied by graphs and other data—even if the data adds no new information whatsoever to the claim.
According to the study, seeing a graph like this one below made more people believe in the drug’s efficacy than just reading about it.
A data-driven approach results in higher reader engagement.
For Buzzfeed, publishing long posts, 3K words or more, results in 123% more shares, on average.
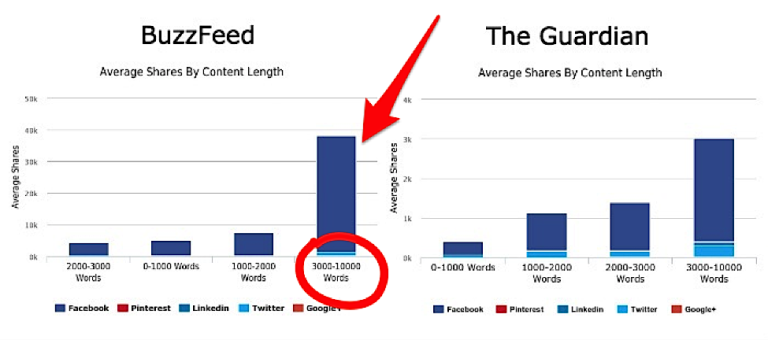
Longer posts also generate more leads.
Curata’s long-form content generated 7x more leads than other content types.
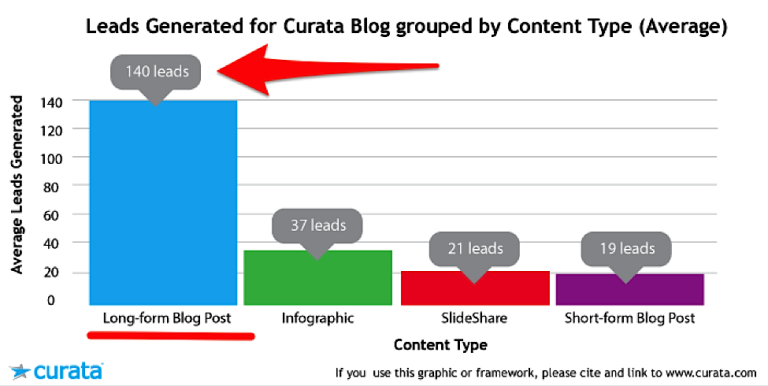
And in another study, the folks at Curata discovered that in-depth, data-driven posts received 9x more leads.

What does a well-written, data-driven post look like?
Here are a couple of examples.
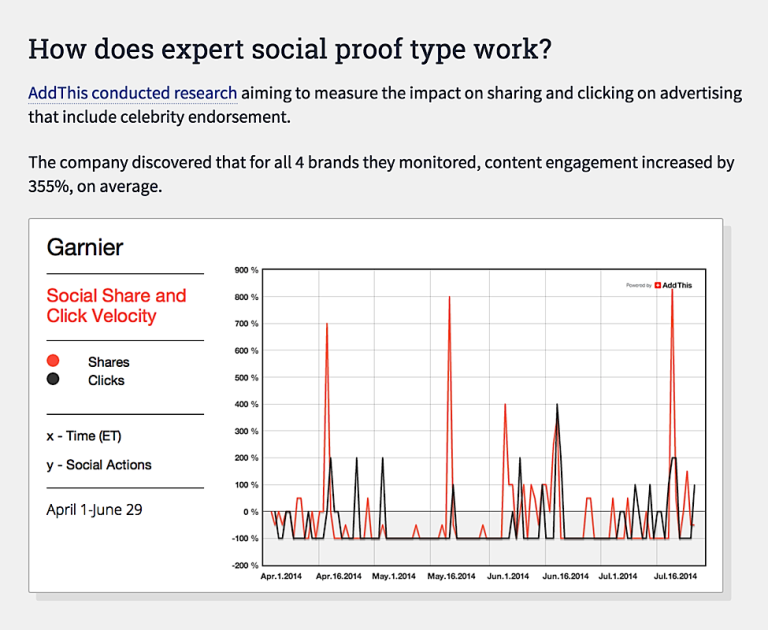
Note: data-driven content is typically long. For the purpose of this post, however, I’m only including screenshots of a small portion of each post. I encourage you to go and review the entire piece.
The Deeper Meaning of Emojis: What You Need to Know on How Social Media is Changing Communication (Buffer)

The Ultimate Guide to Social Proof Marketing (AdEspresso)
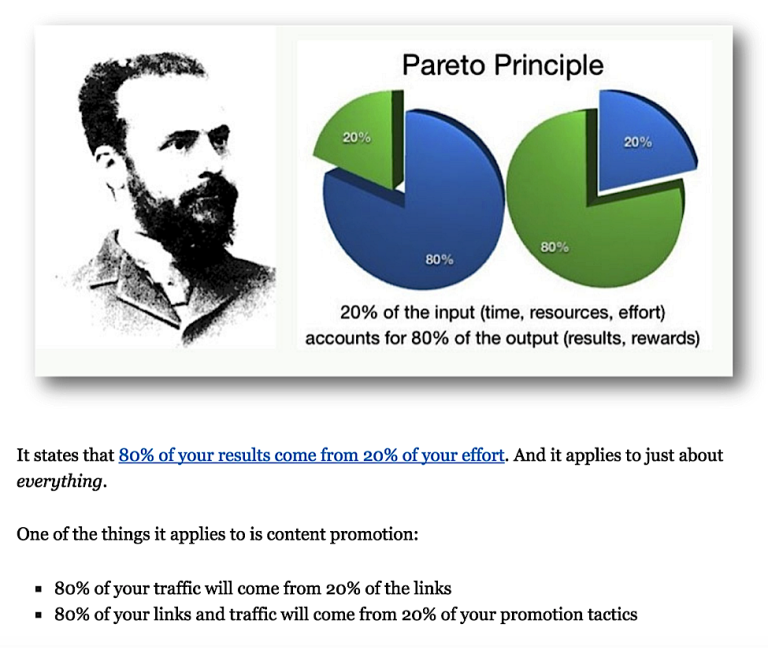
The 8 Most Important Skills for Content Promotion (and How to Learn Them) (QuickSprout)
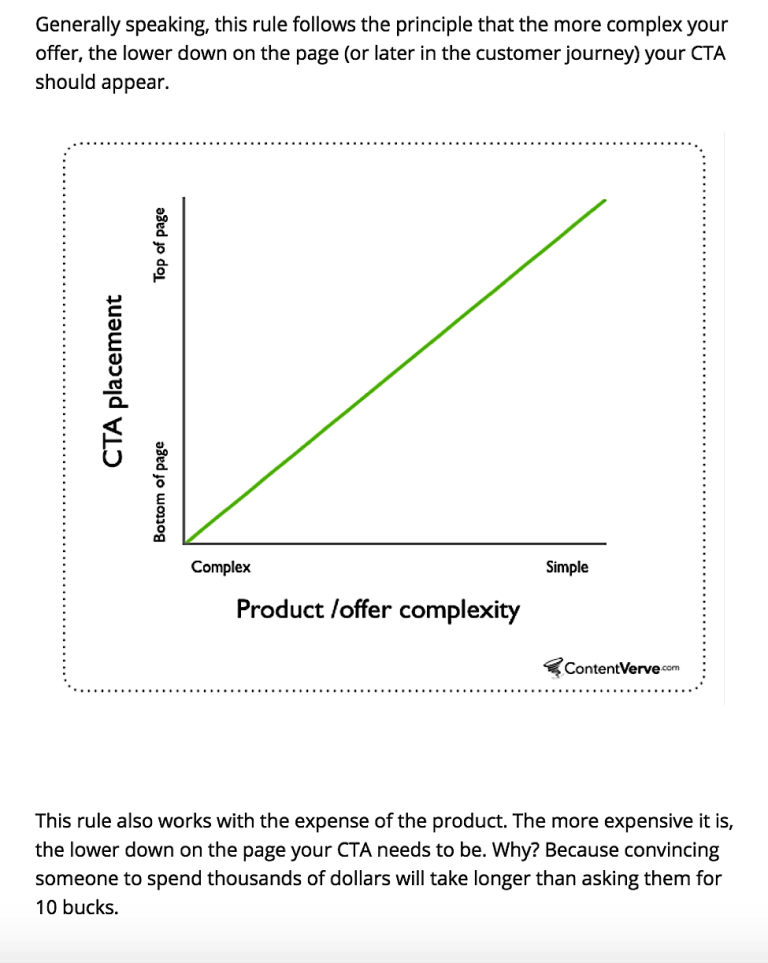
How to Create CTAs that Actually Cause Action (Single Grain)
How to Create Data-Driven Content
Part I: The Data
There’s no data-driven post without the data, obviously, but do you actually know what makes good data?
You see, not every statement you find online counts as good data.
For one, not every bit of information cited on the web is valid. Measuring a test sample size that is too small, working with a poorly-conceived hypothesis or lacking a defined research procedure can ruin any potential findings.
And therefore, to consider the data as valid, it should meet the following criteria:
- It must be verifiable. In other words, you should be able to find other references to it. And even better if you can find the original source of the data.
- It must be acquired by following a defined procedure. You should be able to find information about the process used to obtain the data.
- It must be verified (or at least acknowledged) by experts. Your data doesn’t have to be published in an academic journal, but at the minimum it should somehow be acknowledged by the experts in your field (for instance by being cited or referenced in their work).
- It must pass the statistical conclusion validity.
And in the case of research conducted by businesses:
- It must be acquired using modern tools. Just like with the methodology, you should be able to learn about the process employed to gather the data.
- It must come from a reliable source. And Wikipedia isn’t one. Your research information should come from the source of research or be cited in a reputable resource.
Related Content: Data-Driven Marketing: Your Key to Digital Success
Where to Find the Data for Your Content
Luckily there are many places where you can find data for your posts.
Proprietary Research
The most impressive data you can use is the info you collect yourself.
For one, proprietary research is trustworthy. It’s also unique to you and you alone—no one else has the same data. No other company has the insight into your internal stats, traffic data, customer preferences, common issues or support queries, for instance.
Publicly Available Data
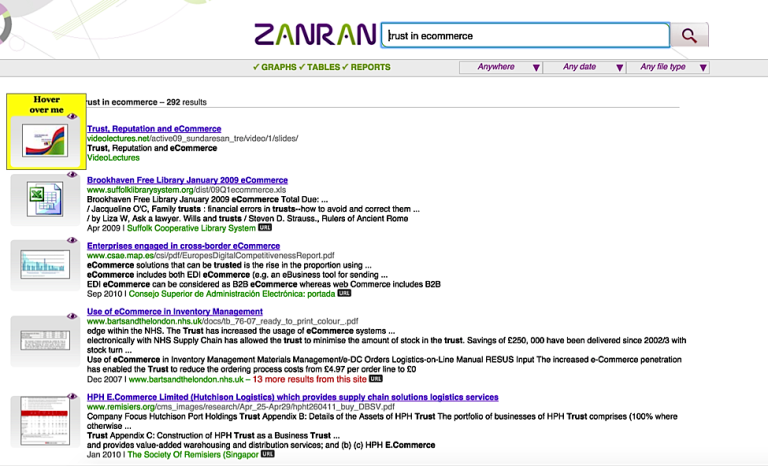
Places like Zanran, a search engine for data and statistics, or Guardian Data offer access to publicly available information you can then use in your piece of content.
Academic Research
Academic findings are the staple of any data-driven post.
Given the strict academic research procedures, this data is always valid. Plus, the breadth of academic research means that there are plenty of interesting insights you can use.
You can find a lot of data on Google Scholar, the search engine’s dedicated academic papers research engine.
Unfortunately, most academic writing is restricted to users of specific research libraries (i.e. Emerald Insight) or academic institutions. One way around it is to use the “inurl:pdf” modifier in the search query. Doing so will return PDF documents accessible without a subscription.
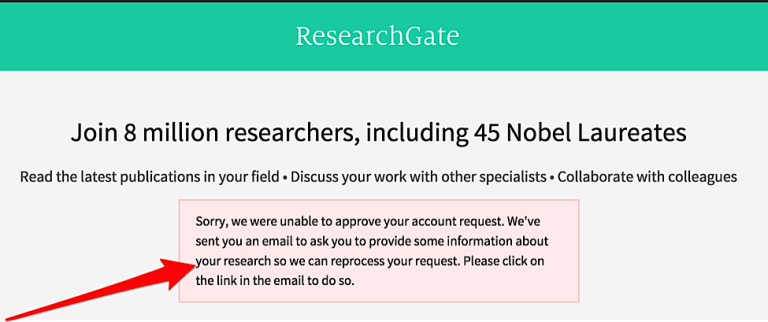
Another great source of academic papers is ResearchGate. It’s a social network for researchers that allows members to upload their papers and browse works of others. You can even contact specific researchers asking for access to their work (if it’s not uploaded to the site yet).
The downside to ResearchGate is that the site has strict membership rules. To be accepted you need to have at least some association with the academic world. For example, I had an account while working on my Master’s degree but all my membership requests to get accepted on the site since finishing my research have been rejected.
Government Data
Most governments offer various data and statistics via dedicated data portals.
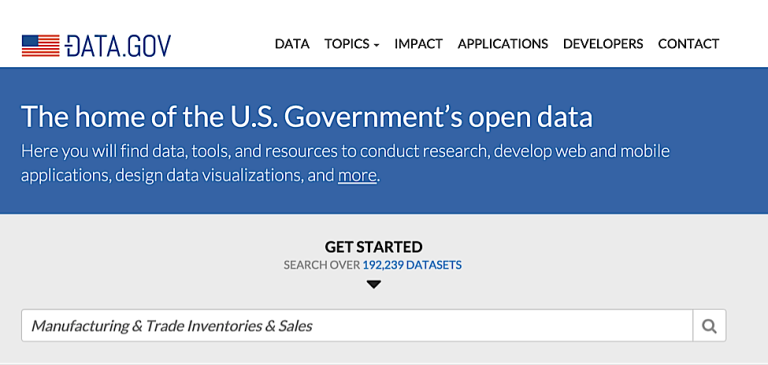
Data.gov is the official government portal in the U.S.
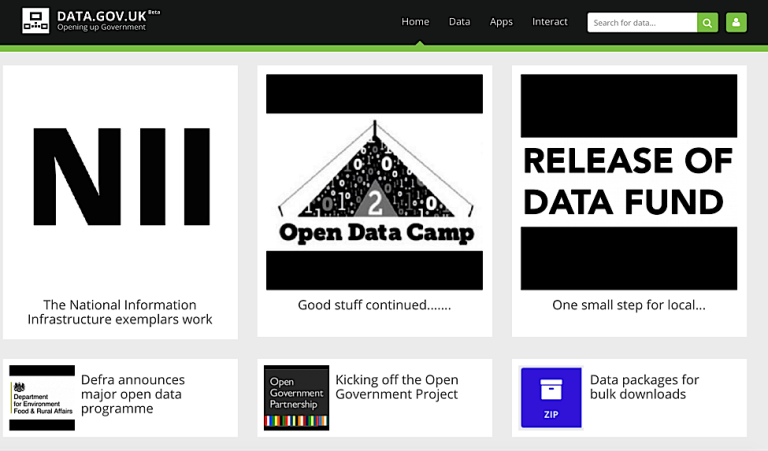
In the UK, it’s data.gov.uk
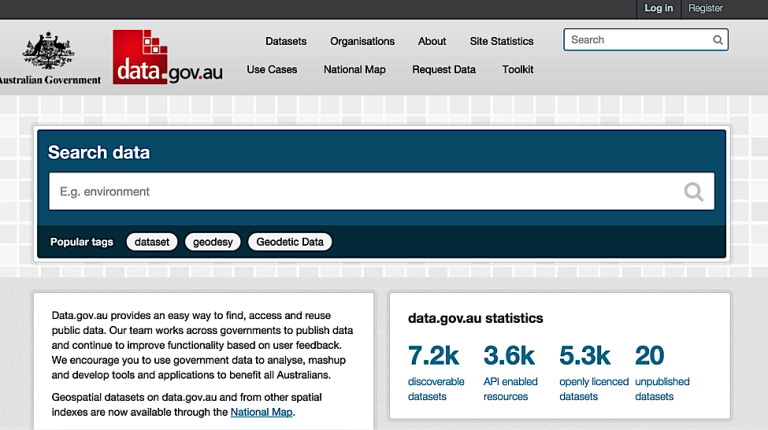
For Australian government data, go to data.gov.au
Part II: Planning the Content
Fact: most people are intimidated by the prospect of writing, let alone creating long-form copy.
And there’s data to prove it, too (of course!). According to the most recent Content Marketing Institute’s B2B Benchmarks Report, 60% of content marketers struggle with creating engaging content.
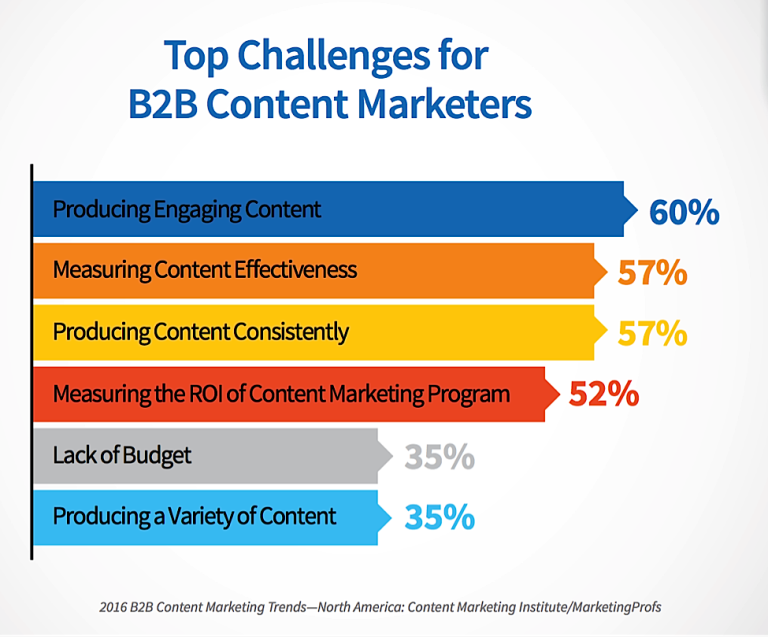
The reason for that may be a lack of understanding of the audience, focusing on wrong content types or perhaps creating too much content. But one thing’s certain. A lot of the struggle has to do with content planning (or lack thereof).
The number one mistake that content marketers make is not asking questions or defining topics that their audience would find engaging.
Instead, they snatch the data available and string it along until they meet the desired word quota…and then wonder why people don’t find their posts interesting.
To avoid making this mistake, plan your content before writing and create a detailed outline.
Start By Defining Your Angle
First, decide what you are trying to teach others with your post.
Second, consider whether your audience actually has the problem that you want to tackle.
Here are a couple of ways to answer this question:
- Review support and customer service tickets. They most likely contain information about the most common problems that your audience encounters.
- Review sales inquiries. Check what problems your prospects have when they start looking for your products or services.
- Monitor questions that your audience asks on Quora.
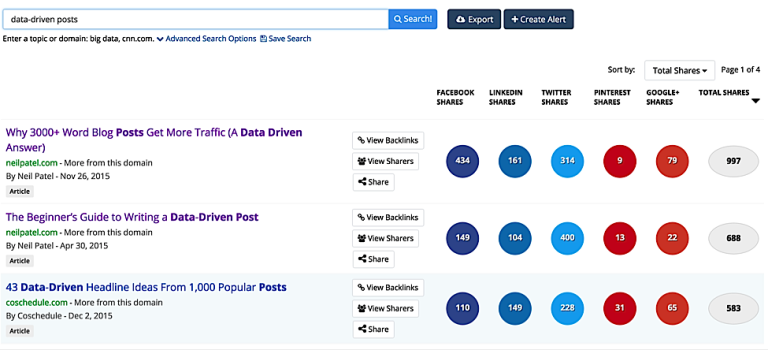
- Use software like Buzzsumo to research which topics are currently popular in your industry.
Personally, before writing any content I ask myself the following 3 questions:
- Who am I writing for? In other words, who is my target persona? Most content you write won’t appeal to your entire audience, so you need to define a specific segment that you want to engage.
- What am I going to teach them? Define my objective for the content.
- Why do they need this information? This helps me to verify if I’m targeting an actual problem rather than something only I think the audience would be interested in.
These 3 questions help me clarify how helpful the content is going to be for the target audience.
Then Create an Outline for Your Piece
Start with the proposed title.
Define the objective for the piece (what do you aim to help the person with?).
Identify the steady-state and target emotions.
Disclaimer: I picked up this advice from Andy Maslen’s fantastic book, Persuasive Copywriting. Maslen outlines two emotions you need to target in your copy:
- The steady-state – how the customer feels about the problem right now
- Target emotion – how you want them to feel once they’ve finished reading the copy
Identifying these two emotions in the outline helps you write a more focused copy. For example, you can open it by referencing the steady-state, making your piece immediately more relevant to the reader. And then use the target emotion to organize the rest of the content, knowing where you want to take the reader emotionally.
Next, list all sections you want to include in the post. Start with main sections and then break them into smaller sub-sections until you’ve exhausted the topic.
Close your outline by defining the takeaway. This is what you’re going to conclude the piece with.
Tip: I add one more element to my outline which defines the next steps. This is what actions I’d like the reader to take after reading the piece.
Here’s a screenshot of my outline for this very article:
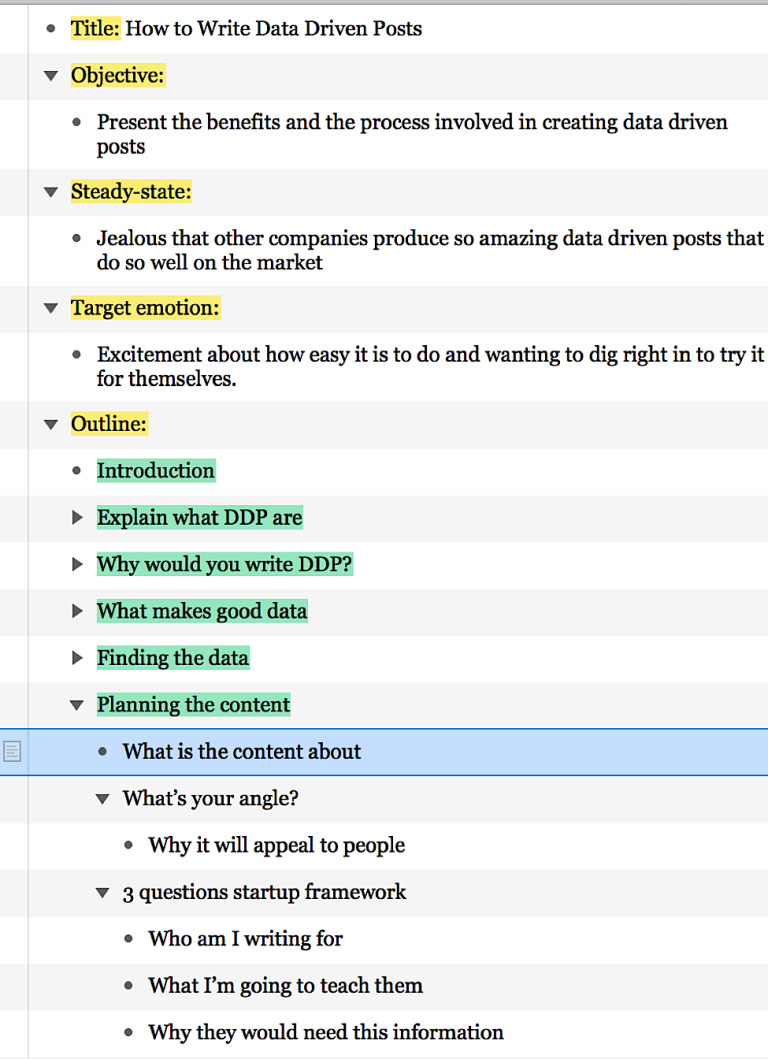
I use software called OmniOutliner to create my outlines. But any text editor or mind-mapping software will work, too.
Part III: The Headline
Finally, let’s talk about the element that’s going to convince someone to read your content:
The headline.
I’m sure you’ve heard this statistic before: on average, 8 out of 10 people will read the headline, but only 2 out of 10 will actually read the content.
But when you think about it, catching someone’s attention isn’t the only job of your headline.
In The Copywriter’s Handbook, Bob Bly (one of my favorite copywriters) lists 3 additional goals that the headline must achieve:
- Select the audience. You’re not writing for everyone. Therefore, your headline should communicate who the target audience of the piece is.
- Deliver the complete message. Since so many readers will skip the copy, it actually makes sense to deliver the full message in the headline.
- Draw the reader into the body copy. It should also arouse curiosity to get the person to click on it and read the copy.
How do you achieve this? One way is to use data to arouse curiosity.
Just take a look at these headlines:


The data they include in the headline tells the story and makes it irresistible to click on it, doesn’t it?
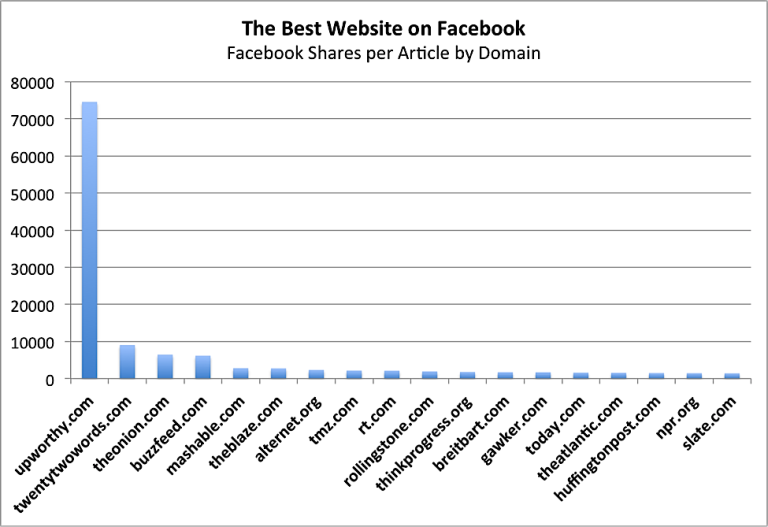
Upworthy has been using this strategy for a while and traffic to curiosity-arousing headlines is often 500% greater compared to standard headlines.
Not to mention that those posts also receive 152% more Facebook likes, compared to other sites.
Are curiosity headlines the only type to use?
No, of course not. There are other types of headlines that you can test to see which ones engage your audience the most:
- Direct headlines
- Indirect headlines
- News-based headlines
- How-to headlines
- Question headlines
- Reason-why headlines
- Command headlines
However, when you’re writing a data-driven post, it’s a good idea to highlight your findings in the headline or include some intriguing data to attract more readers to the content.
Closing Thoughts
Trying to increase reader engagement, shares, and conversions from your blog is so darn frustrating.
But now you know one of the secrets of their success—write data-driven posts to increase traffic to your blog.
Remember that your content must be credible, authoritative, and trustworthy. Your high-quality posts should state a common problem the reader has and then offer a solution that is backed by scientific findings, data, and up-to-date research. Include relevant graphs and charts, and don’t skimp on the length to ensure that you fully explore the topic (both the issue and the solution) for your readers.
Have you seen an increase in traffic to your website by writing data-driven blog posts? Share your thoughts and experience in the comments below!


